In a stunning turn of events, Bitcoin has shattered expectations again, surging past the $30,000 level for the first time since April. This extraordinary milestone has reignited the enthusiasm among cryptocurrency enthusiasts and left skeptics questioning whether Bitcoin can sustain its upward trajectory.

Source: Bing
The question on everyone’s mind is whether Bitcoin has what it takes to keep rising. Despite the exhilarating surge, it’s worth noting that Bitcoin faces a formidable hurdle near the $30,700 mark, forming a double-top pattern that demands careful consideration.
Let’s delve into the analysis and examine the factors to illuminate this critical juncture. Recent releases of unemployment claim data and the current account deficit report have significant implications for the Bitcoin market, influencing market sentiment and potential monetary policies.
Unemployment claims data reveals a potential weakening in the labor market as the Federal Reserve tightens credit conditions. Steady high claims at a 20-month peak raise concerns, with economists’ expectations slightly lower than the actual figures.
Furthermore, the widened current account deficit in the US hints at the flow of goods, services, and investments, with potential repercussions for the economy’s overall health. These economic indicators, alongside Bitcoin’s upward momentum, create an intriguing environment for traders and investors alike.
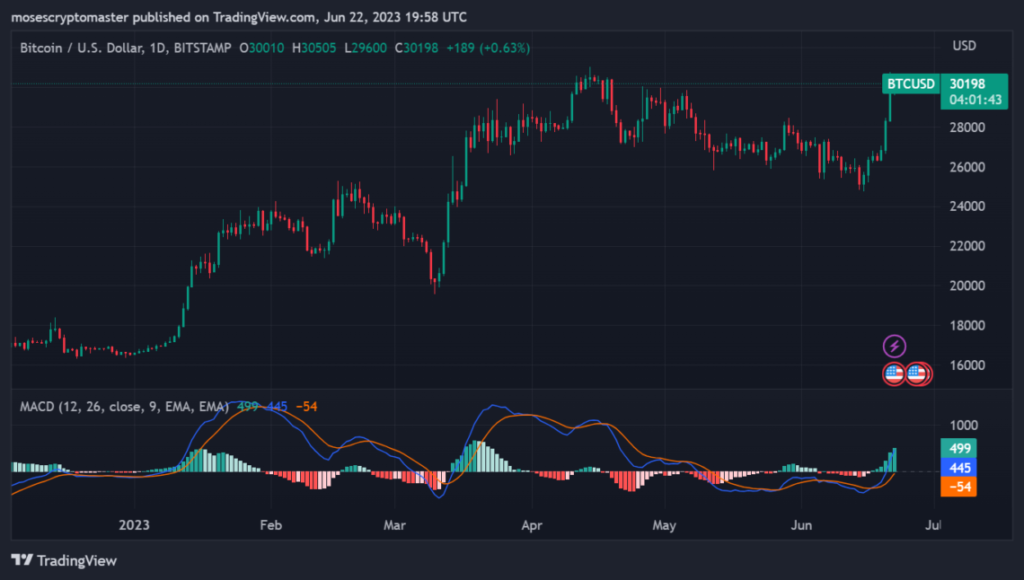
Examining the technical analysis, we observe both bullish and cautionary signals. The formation of three bullish candles, known as “three white soldiers,” has propelled Bitcoin toward the $30,000 level. However, the significant resistance around $30,700, marked by a double-top pattern, poses a potential threat to Bitcoin’s upward momentum.
Failing to breach this resistance could trigger a corrective move, possibly leading to a retracement towards the 23.6% Fibonacci level at $29,300. Further selling pressure may drive the price toward the 38.2% Fibonacci level, around $28,400.
Should a more pronounced bearish trend emerge, the $27,000 area becomes a crucial support. As a previous resistance level, its significance is magnified, reinforced by a downward channel on the daily timeframe chart.
While technical indicators such as the Relative Strength Index (RSI) and Moving Average Convergence Divergence (MACD) suggest a potential weakening of bullish momentum, the market remains volatile and subject to rapid shifts.

Source: TradingView
Traders and investors must tread cautiously, keeping a close eye on the $30,700 level for potential short positions or monitoring a retracement towards the $27,000 area for attractive buying opportunities.
Bitcoin’s journey continues to captivate the financial world, breaking barriers and defying doubts. As the cryptocurrency’s price soars, the global community eagerly watches to see if Bitcoin can maintain its remarkable ascent or if obstacles will impede its progress.


Leave a Reply